Building a Slurm HPC Cluster (Part 2) - Scaling to Production with Ansible

In Part 1, we learned the fundamentals by building a single-node Slurm cluster. Now it's time to scale up to a production-ready, multi-node cluster with automated deployment, monitoring, and alerting.
In this post, we'll use Ansible to automate the entire deployment process, making it reproducible and maintainable.
Series Overview
- Part 1: Introduction, Architecture, and Single Node Setup
- Part 2 (This Post): Scaling to Production with Ansible
- Part 3: Administration and Best Practices
Why Ansible for HPC Clusters?
Moving from a single-node setup to a multi-node production cluster involves:
- Configuring multiple machines identically
- Managing dependencies and installation order
- Keeping configurations synchronized
- Handling user management across nodes
- Setting up monitoring and logging infrastructure
Doing this manually is error-prone and time-consuming. Infrastructure automation tools like Ansible, Puppet, or Terraform solve this problem. We chose Ansible because:
- Agentless: No software to install on managed nodes
- Declarative: Describe the desired state, not the steps
- Idempotent: Safe to run multiple times
- YAML-based: Easy to read and version control
- Large ecosystem: Many pre-built roles available
What is Ansible? (Quick Primer)
If you're new to Ansible, watch this excellent 100-second introduction:
Production Cluster Architecture
Our production setup includes these components:

Head Node (Controller + Login)
The head node manages the cluster and provides user access:
- slurmctld: Job scheduling and resource management
- slurmdbd: Accounting database
- NFS Server: Shares directories to compute nodes
- Prometheus: Metrics collection
- Grafana: Monitoring dashboards
- Alertmanager: Slack notifications
Compute Nodes
Worker nodes that execute jobs:
- slurmd: Job execution daemon
- NFS Client: Mounts shared storage
- Node Exporter: Exposes system metrics
- Slurm Exporter: Exposes Slurm-specific metrics
Shared Storage (NFS)
NFS provides unified file system access across all nodes:
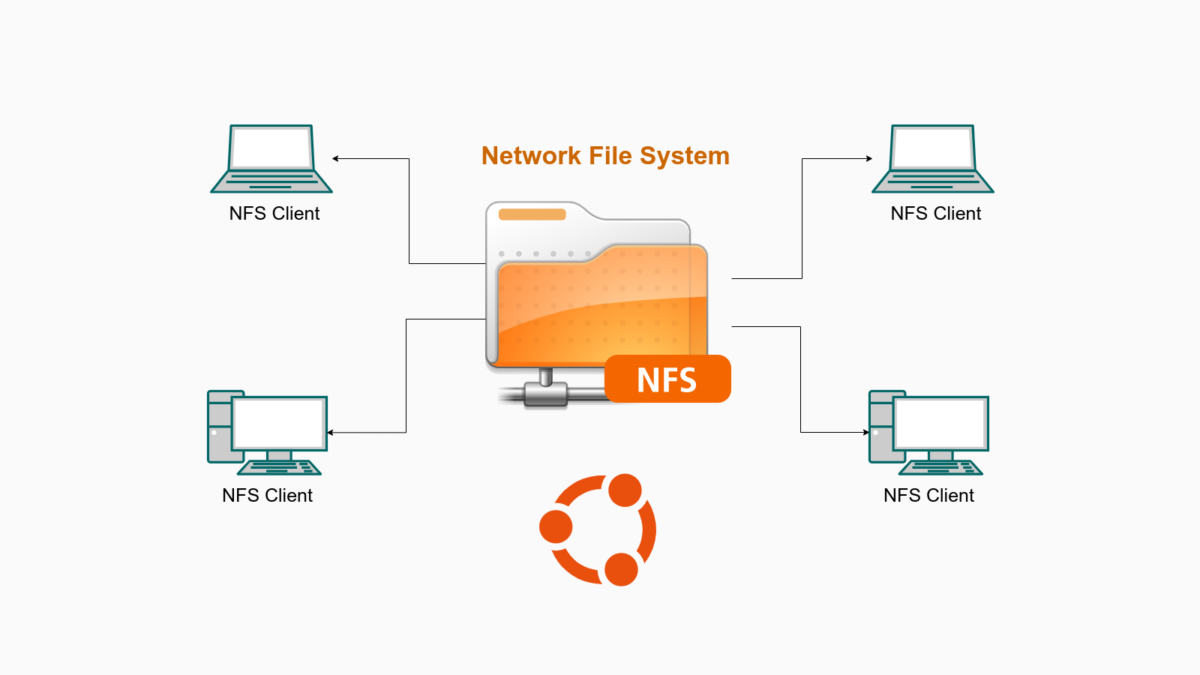
Source: https://thuanbui.me/cai-dat-nfs-server-va-nfs-client-tren-ubuntu-22-04/
/home: User home directories (fast SSD/NVMe storage)/mnt/data: Large datasets (high-capacity HDD)
Monitoring Stack
Complete observability for your cluster:
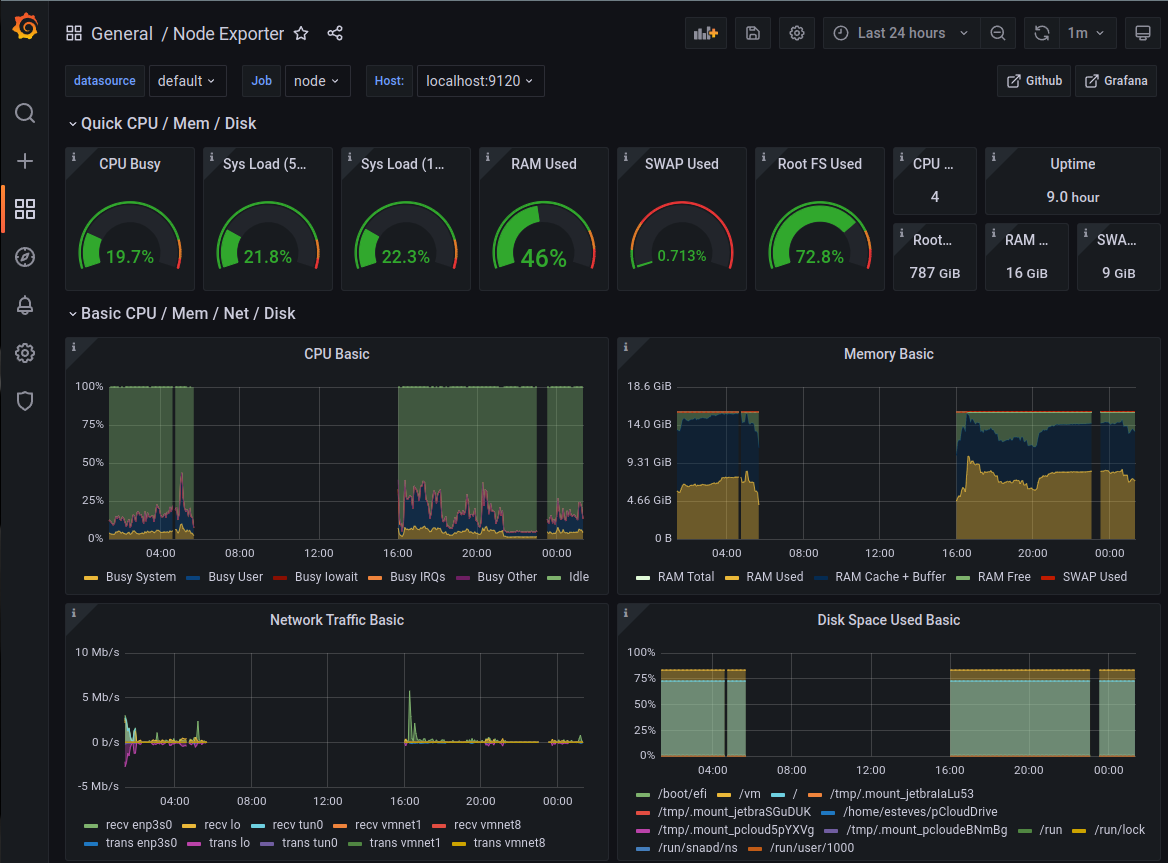
Source: https://swsmith.cc/posts/grafana-slurm.html
- Prometheus: Time-series metrics database
- Grafana: Beautiful dashboards for visualization
- Alertmanager: Sends alerts to Slack when issues occur
- Node Exporter: System-level metrics (CPU, memory, disk)
- Slurm Exporter: Slurm-specific metrics (jobs, partitions, nodes)
Setting Up the RiverXData Slurm Cluster
We've created a comprehensive Ansible playbook that automates everything. Let's get started!

Prerequisites
- Multiple Ubuntu 20.04 or 24.04 machines (or VMs)
- SSH access to all nodes
- Sudo privileges on all nodes
- A Slack workspace (for alerts)
Step 1: Clone the Repository
git clone https://github.com/riverxdata/river-slurm.git -b 1.0.0
cd river-slurm
Step 2: Install Ansible and Dependencies
# Ubuntu 24.04, without Vagrant
bash scripts/setup.sh 24.04 false

# For Ubuntu 20.04
bash scripts/setup.sh 20.04 false

# For developers: Install with Vagrant support
bash scripts/setup.sh 24.04 true
This script installs:
- Ansible and required Python packages
- Community Ansible collections
- Galaxy roles (geerlingguy.docker, etc.)
Step 3: Set Up Slack Alerts
In production environments, even small teams benefit from proactive monitoring. Slack is perfect for this - you'll get notifications when nodes go down, jobs fail, or resources run low.
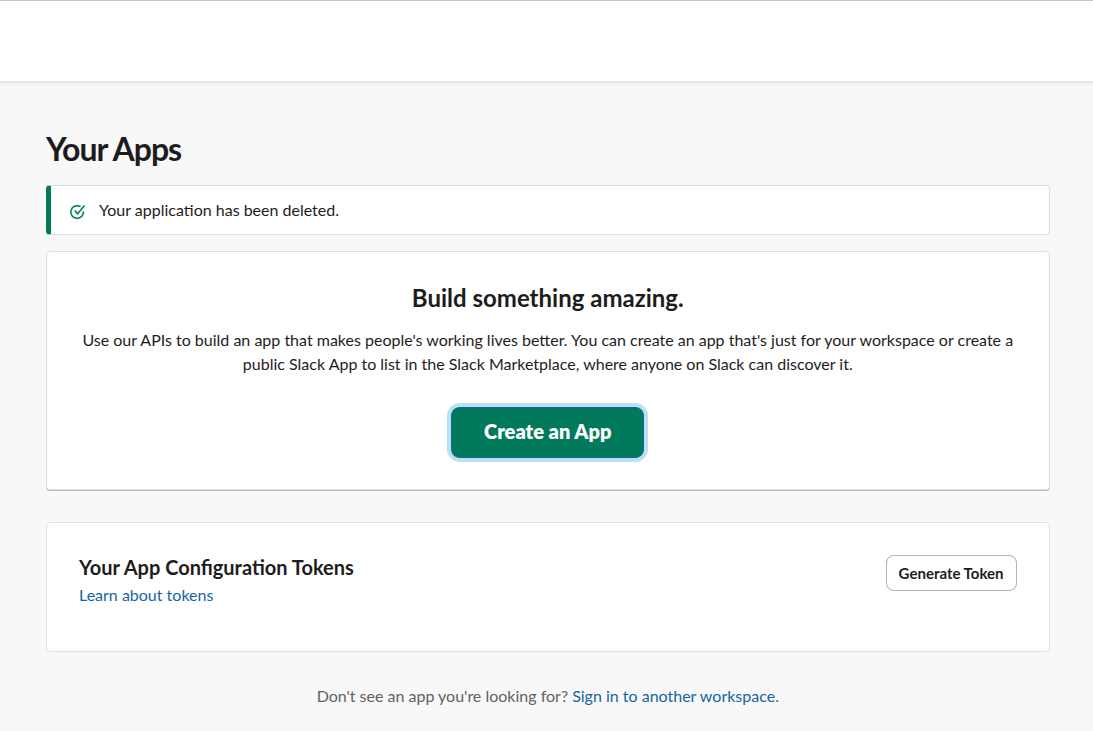
Create a Slack App
- Go to Slack API and create a new app
- Choose "From scratch"
- Name it (e.g., "Slurm Cluster Monitor")
- Select your workspace
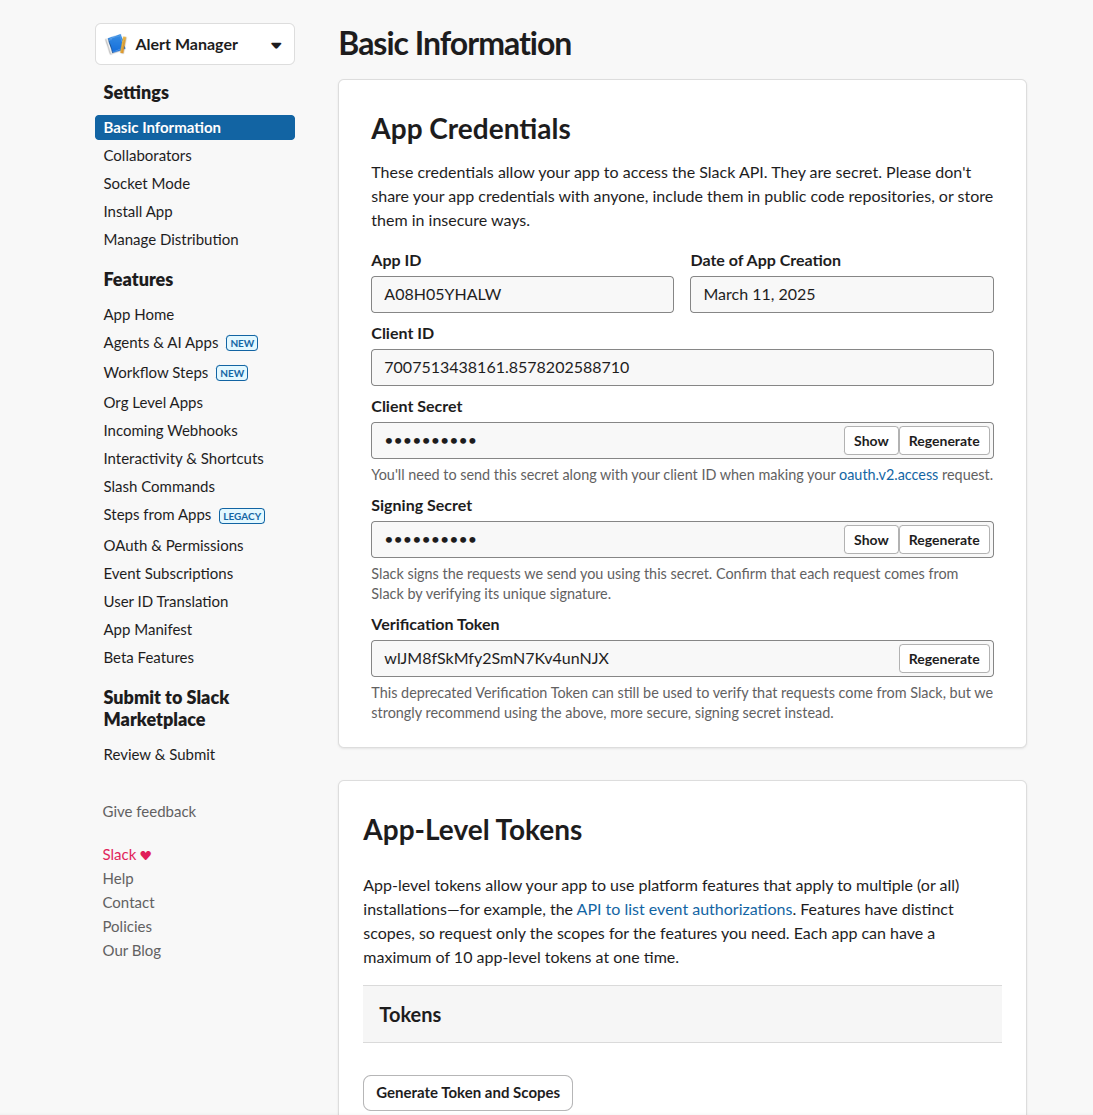
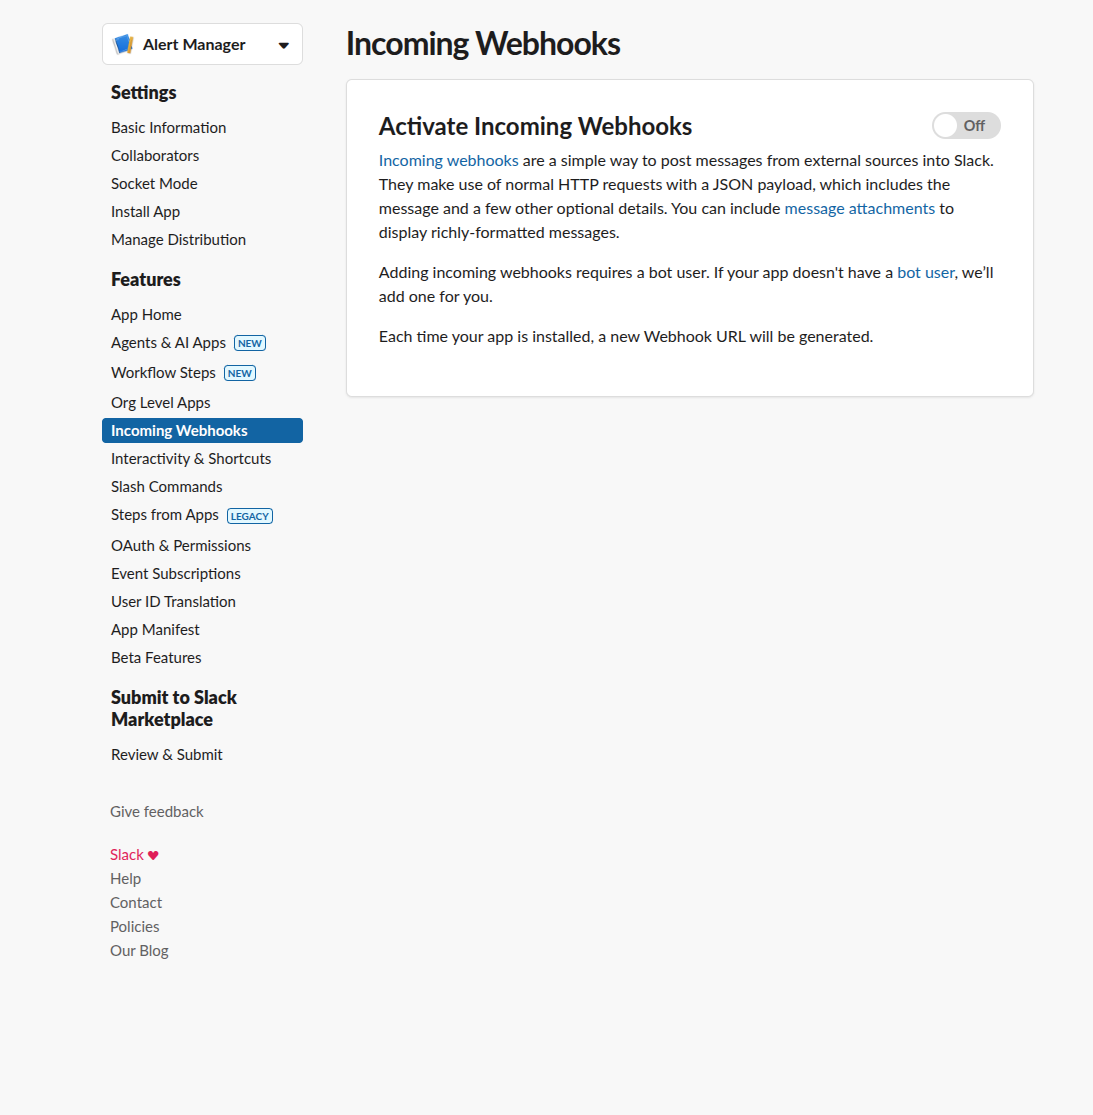
Enable Incoming Webhooks
- Navigate to "Incoming Webhooks" in your app settings
- Activate incoming webhooks
- Click "Add New Webhook to Workspace"
- Select the channel for notifications (e.g.,
#cluster-alerts) - Copy the webhook URL
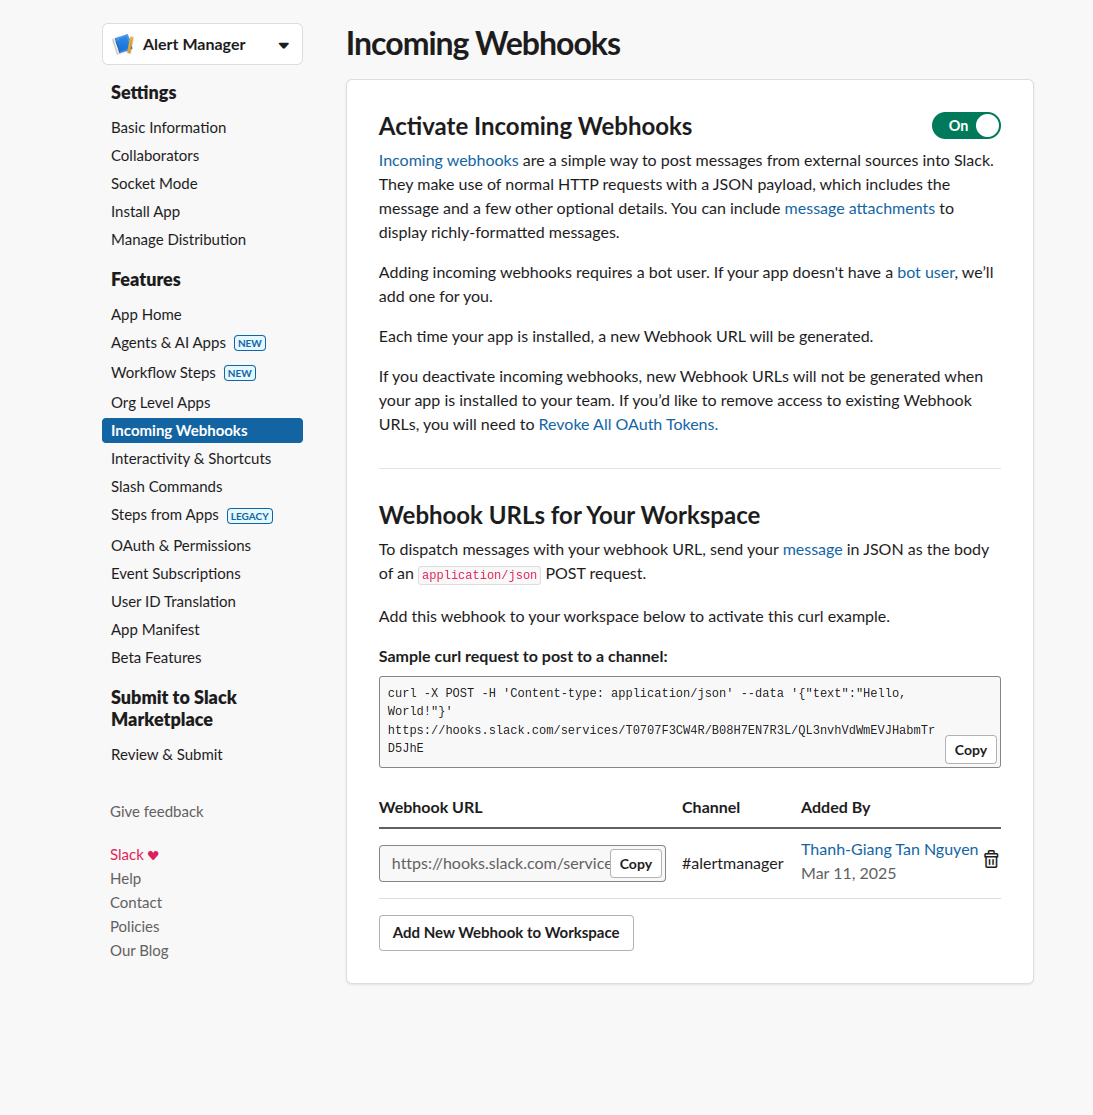
Test Your Webhook
curl -X POST -H 'Content-type: application/json' \
  --data '{"text":"Hello from Slurm cluster!"}' \
  https://hooks.slack.com/services/YOUR/WEBHOOK/URL
You should see the message appear in your Slack channel!
Step 4: Configure Your Inventory
Create inventories/hosts (or copy from inventories/hosts.example):
[slurm_master]
controller-01 ansible_host=192.168.58.10

[slurm_worker]
worker-01 ansible_host=192.168.58.11
worker-02 ansible_host=192.168.58.12

[slurm:children]
slurm_master
slurm_worker

[all:vars]
ansible_user=your_username
slurm_password=secure_munge_password
slurm_account_db_pass=secure_db_password
slack_api_url=https://hooks.slack.com/services/YOUR/WEBHOOK/URL
slack_channel=#cluster-alerts
admin_user=admin
admin_password=secure_grafana_password
Security Best Practice: Use Ansible Vault to encrypt sensitive variables like passwords and API keys.
# Create encrypted vault
ansible-vault create inventories/vault.yml

# Or encrypt existing file
ansible-vault encrypt inventories/hosts
Optional Parameters
default_password=temporary_user_password  # Forces change on first login
users=alice,bob,charlie                   # Comma-separated list
Step 5: Deploy the Cluster
Now for the magic moment - deploy your entire cluster with one command!
# If you have passwordless sudo configured
ansible-playbook -i inventories/hosts river_cluster.yml

# If you need to enter sudo password
ansible-playbook -i inventories/hosts river_cluster.yml --ask-become-pass
What this playbook does:
-
Prepares all nodes:
- Updates packages
- Installs dependencies
- Configures firewalls
-
Sets up the controller:
- Installs slurmctld and slurmdbd
- Configures MariaDB for accounting
- Sets up NFS server
- Installs monitoring stack
-
Configures compute nodes:
- Installs slurmd
- Mounts NFS shares
- Configures metrics exporters
-
Deploys monitoring:
- Prometheus for metrics collection
- Grafana with pre-configured dashboards
- Alertmanager with Slack integration
-
Synchronizes configurations:
- Copies slurm.conf to all nodes
- Sets up Munge authentication
- Configures log aggregation
Step 6: Add Users
ansible-playbook -i inventories/hosts river_users.yml
This creates Linux users on all nodes with:
- Synchronized UID/GID across nodes
- Home directories on shared NFS
- Slurm accounting associations
Note on User Management: For production, consider integrating with LDAP or Active Directory. However, NIS and LDAP setup can be complex on Ubuntu. Our Ansible approach provides a simpler alternative that works well for small to medium clusters.
Step 7: Verify the Setup
SSH into the controller node and run:
# Check cluster status
sinfo

# Expected output:
# PARTITION AVAIL  TIMELIMIT  NODES  STATE NODELIST
# compute*     up   infinite      2   idle worker-01,worker-02

# View job queue
squeue

# Submit a test job
srun --nodes=1 --ntasks=1 hostname

# Check accounting
sacct

# View cluster configuration
scontrol show config | head -20
Step 8: Access Grafana Dashboards
Grafana runs on the controller node at port 3000. To access it securely from your local machine:
# Create SSH tunnel
ssh -N -L 3001:localhost:3000 your_user@controller_ip

# Now open in browser: http://localhost:3001
# Login: admin / your_grafana_password
You'll see pre-configured dashboards showing:
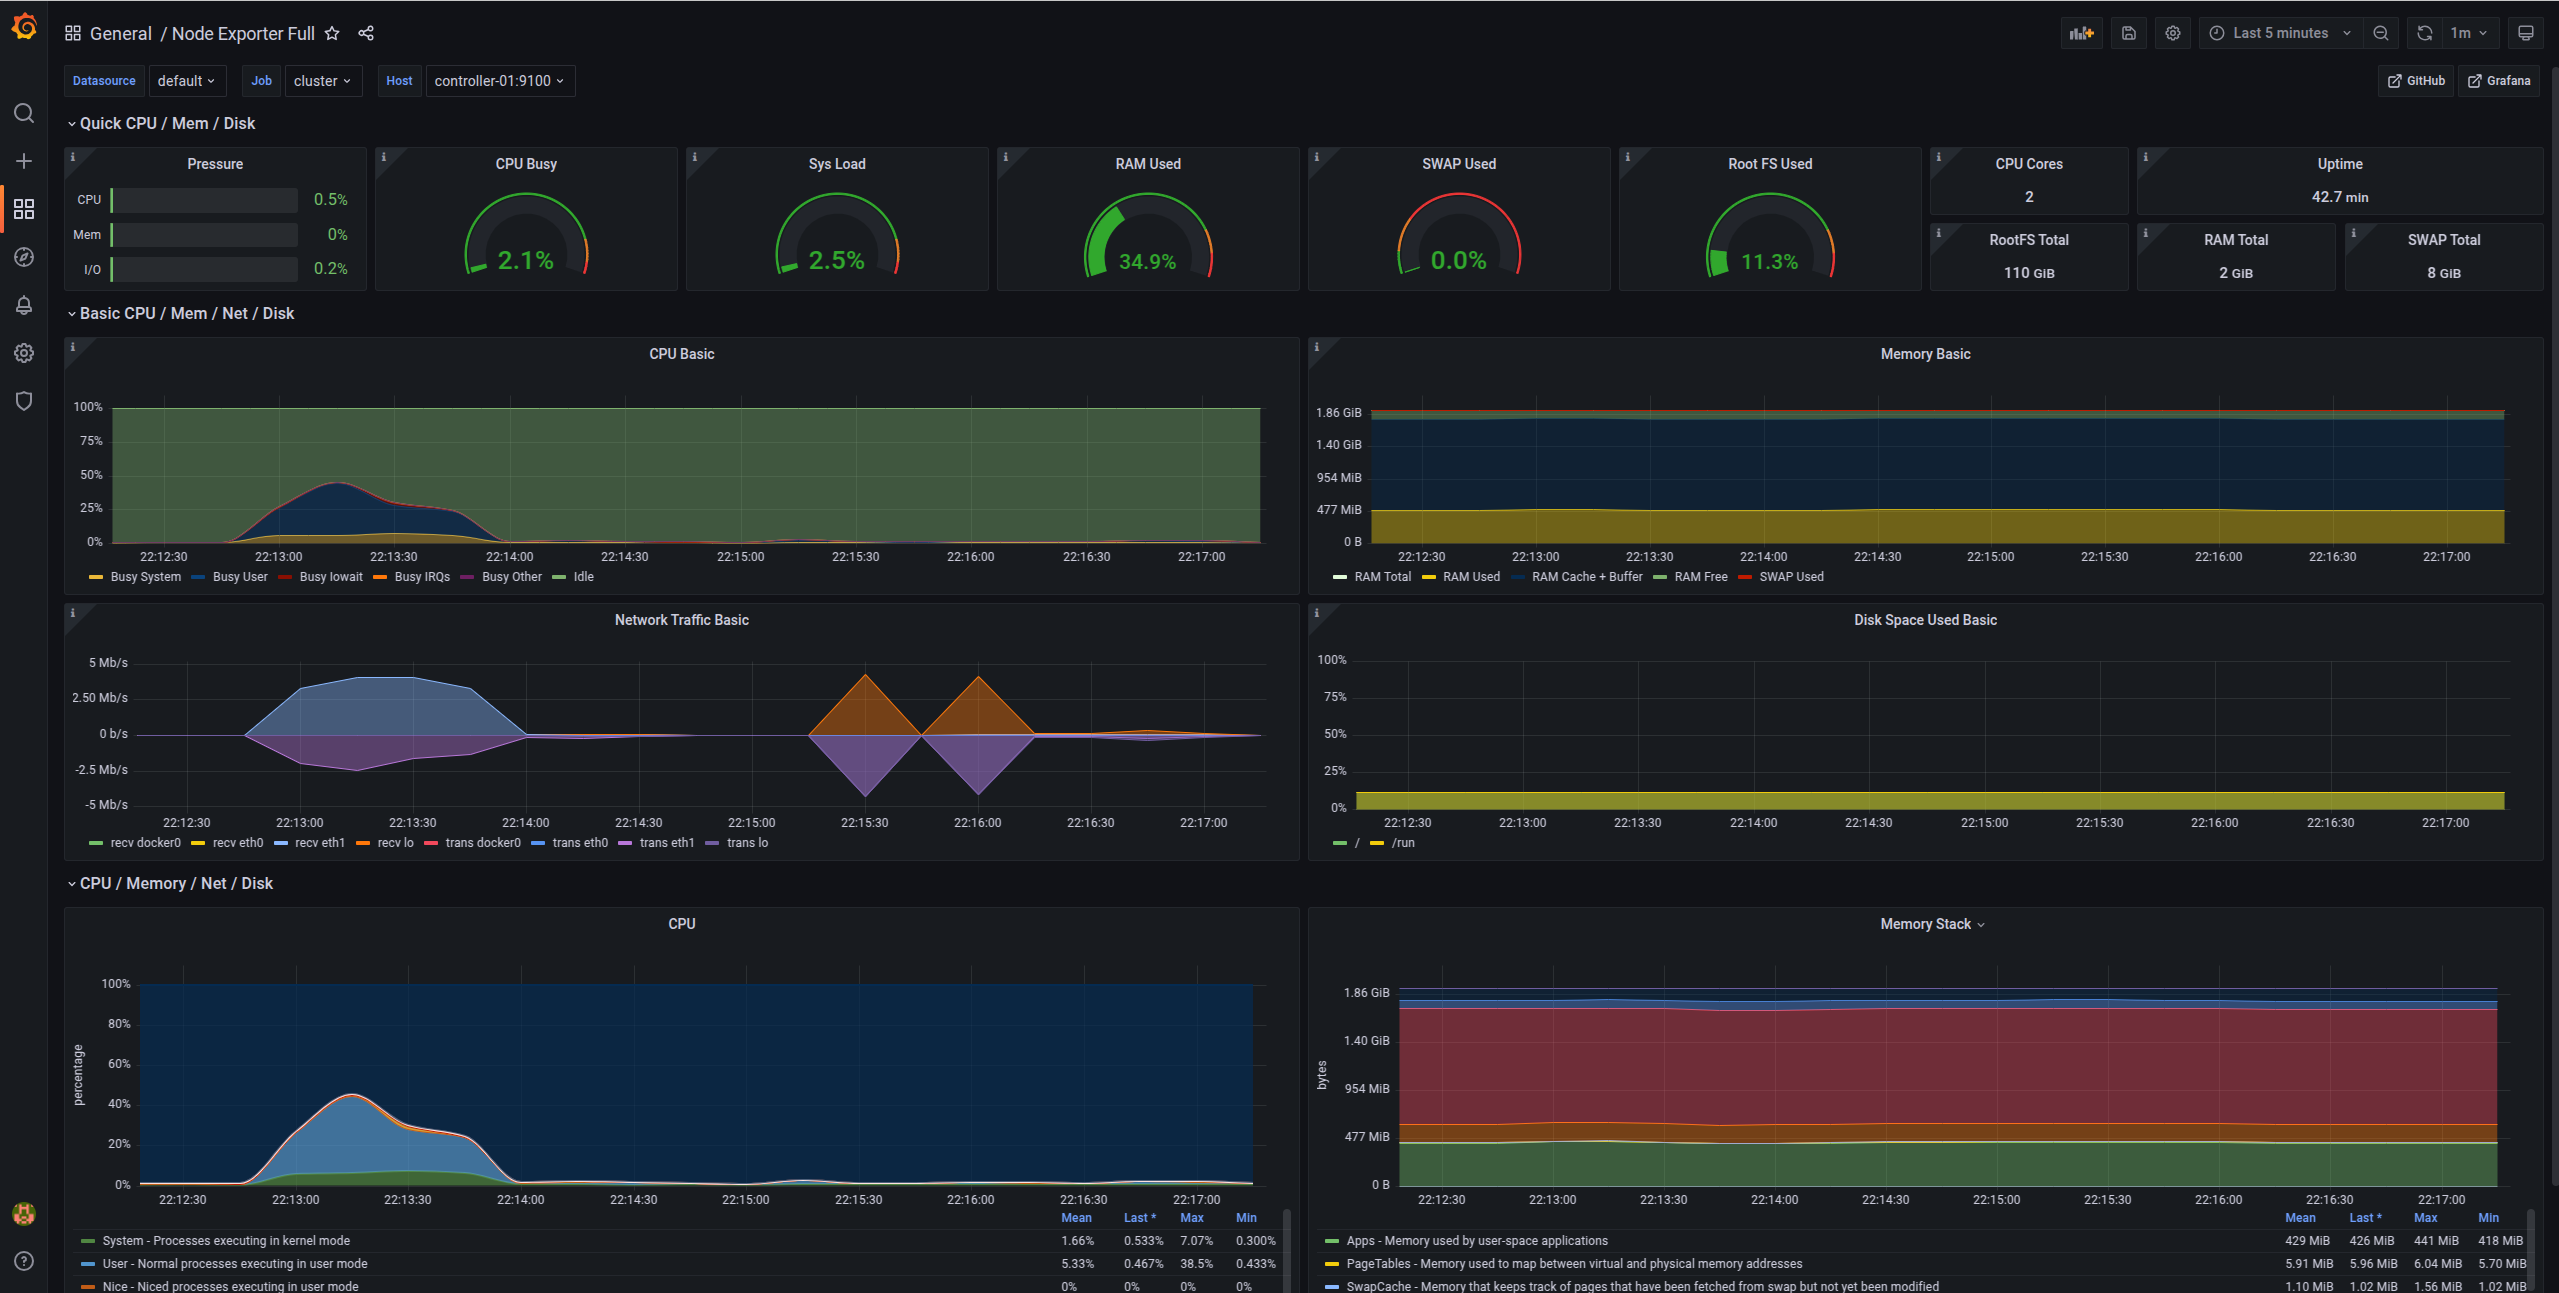
Node Metrics Dashboard
- CPU usage per node
- Memory utilization
- Disk I/O
- Network traffic
- System load
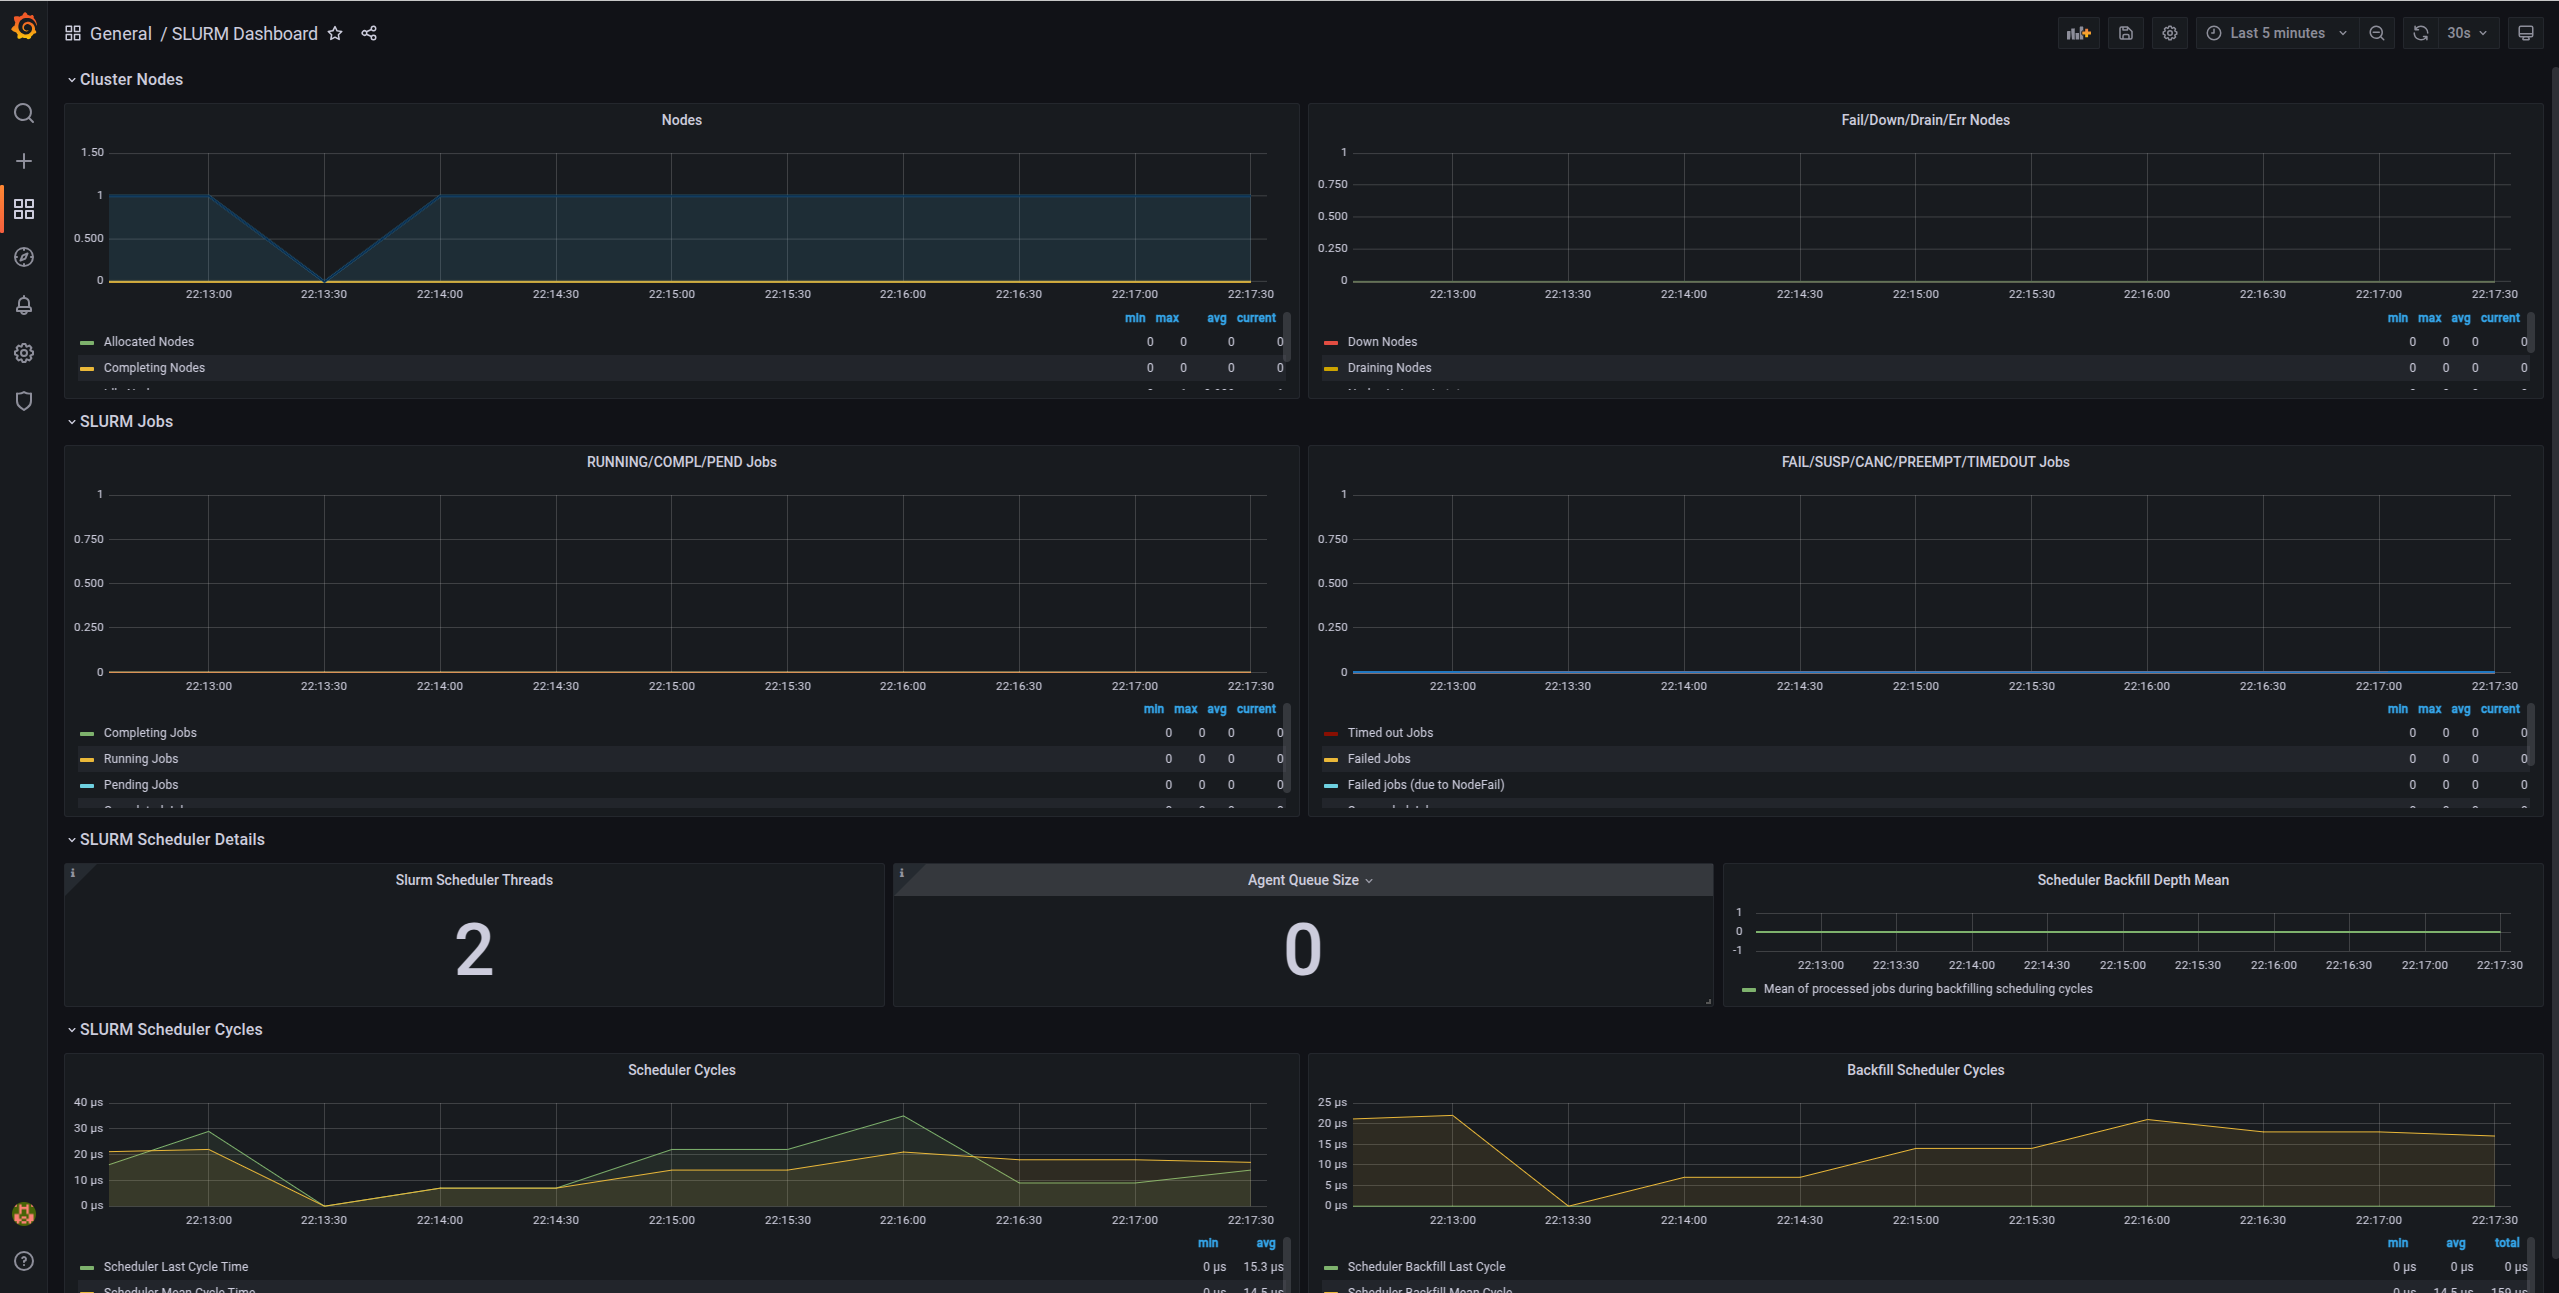
Slurm Metrics Dashboard
- Active jobs
- Job queue length
- Node states (idle, allocated, down)
- CPU allocation
- Memory usage
- Job completion rates
What About Alerts?
Alertmanager is configured to send Slack notifications for:
- Node down: When a compute node becomes unresponsive
- Node resumed: When a node comes back online
- High CPU usage: Sustained high CPU across cluster
- High memory usage: Memory pressure warnings
- Disk space low: Storage running out
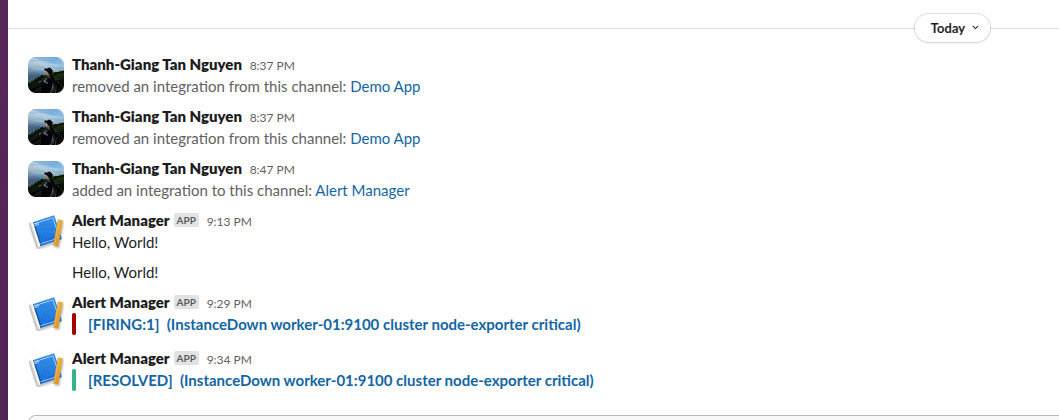
Example alert in Slack when a node goes down:
For detailed information, check the Grafana dashboard:
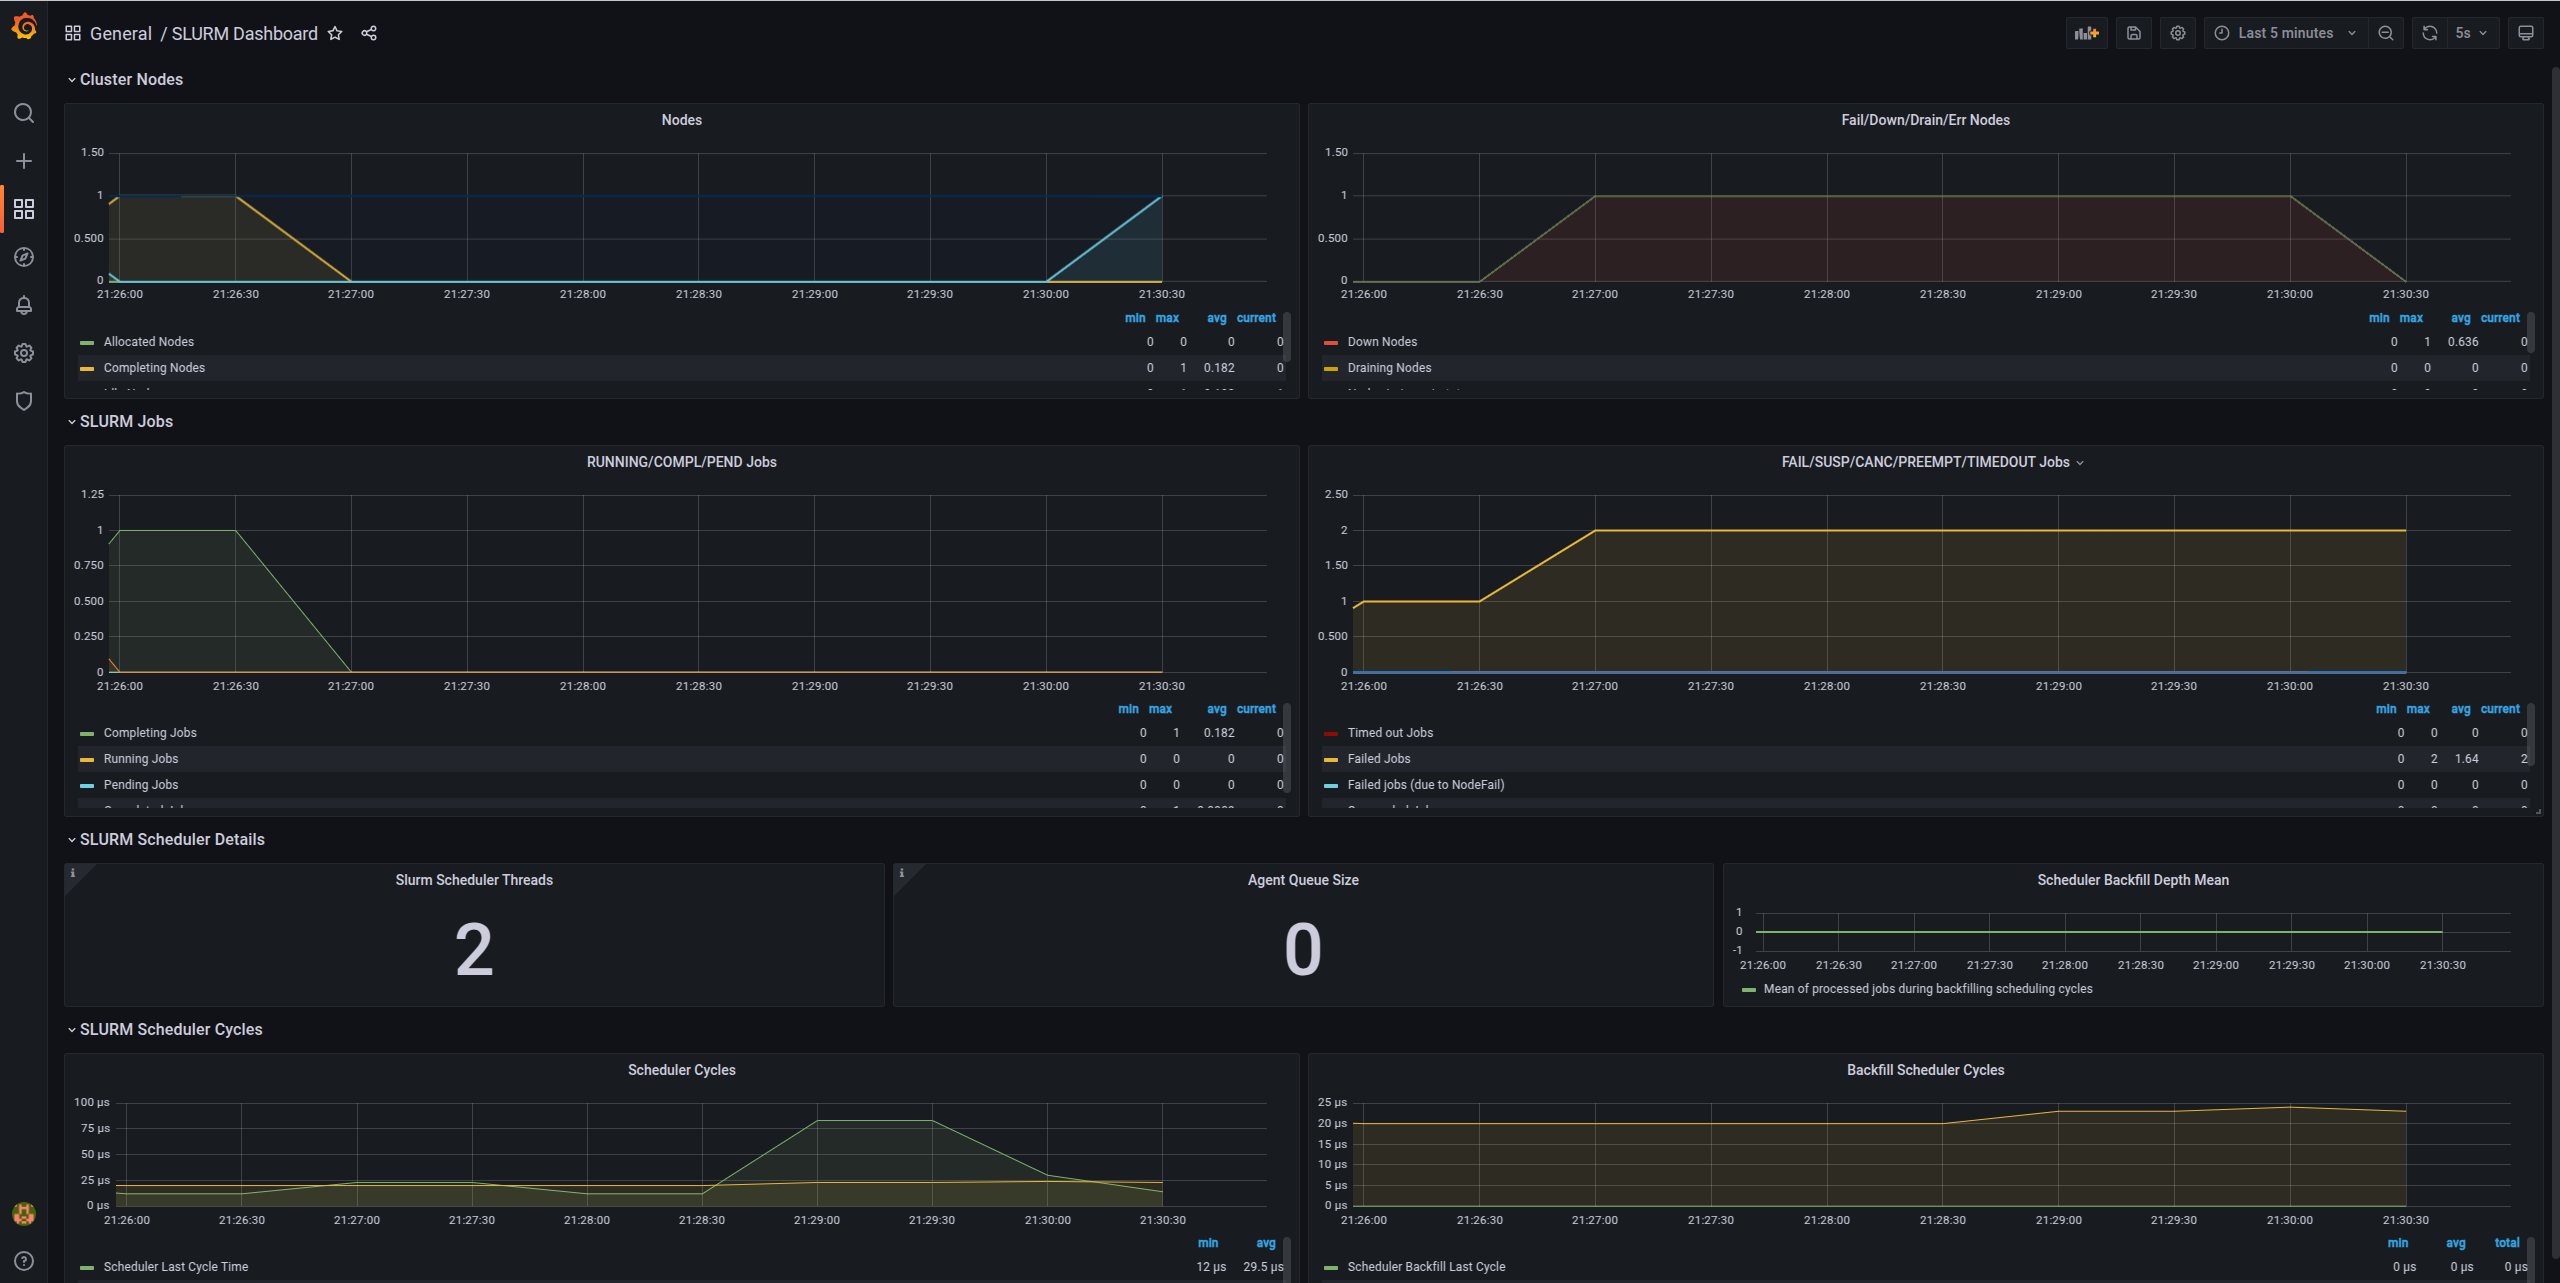
Testing Your Cluster
Let's run some tests to ensure everything works:
Test 1: Simple Job
srun hostname
Test 2: Multi-node Job
srun --nodes=2 --ntasks=2 hostname
Test 3: Interactive Session
srun --nodes=1 --cpus-per-task=2 --mem=2G --pty bash

# Inside the session
hostname
nproc
free -h
exit
Test 4: Batch Job
Create test_job.sh:
#!/bin/bash
#SBATCH --job-name=test
#SBATCH --output=test_%j.out
#SBATCH --error=test_%j.err
#SBATCH --nodes=1
#SBATCH --ntasks=1
#SBATCH --cpus-per-task=2
#SBATCH --mem=1G
#SBATCH --time=00:05:00

echo "Job started at $(date)"
echo "Running on node: $(hostname)"
echo "CPUs allocated: $SLURM_CPUS_PER_TASK"
echo "Memory allocated: $SLURM_MEM_PER_NODE MB"

# Do some work
sleep 60

echo "Job finished at $(date)"
Submit it:
sbatch test_job.sh

# Check status
squeue

# When done, view output
cat test_*.out
Test 5: Resource Limits
# Submit job requesting more resources than available
srun --mem=999999 --pty bash

# Should fail with:
# srun: error: Unable to allocate resources: Requested node configuration is not available
Test 6: Accounting
# View your jobs
sacct

# Detailed accounting info
sacct --format=JobID,JobName,User,State,Start,End,Elapsed,CPUTime,MaxRSS

# Cluster usage summary
sreport cluster utilization
Architecture Diagram
Here's what you've built:
┌─────────────────────────────────────────────┐
│           Users SSH to Controller           │
└─────────────────┬───────────────────────────┘
                  │
    ┌─────────────▼────────────────┐
    │   Controller Node (Head)     │
    │  ┌────────────────────────┐  │
    │  │ slurmctld              │  │  Job Scheduling
    │  │ slurmdbd + MariaDB     │  │  Accounting
    │  │ NFS Server             │  │  Shared Storage
    │  │ Prometheus + Grafana   │  │  Monitoring
    │  │ Alertmanager           │  │  Alerts
    │  └────────────────────────┘  │
    └────┬──────────────────┬──────┘
         │                  │
    ┌────▼─────┐       ┌───▼──────┐
    │ worker-01│       │ worker-02│
    │ ┌──────┐ │       │ ┌──────┐ │
    │ │slurmd│ │       │ │slurmd│ │
    │ │NFS ↑ │ │       │ │NFS ↑ │ │
    │ └──────┘ │       │ └──────┘ │
    └──────────┘       └──────────┘
For Developers: Local Testing with Vagrant
If you want to test the deployment locally using VMs:
# Install Vagrant with libvirt provider
bash scripts/setup.sh 24.04 true

# Create local VMs and deploy cluster
vagrant up

# SSH to controller
vagrant ssh controller-01

# Destroy VMs when done
vagrant destroy -f
Key Takeaways
In this post, we've covered:
- Why Automation: The benefits of using Ansible for cluster management
- Production Architecture: Multi-node setup with monitoring and alerting
- Slack Integration: Proactive monitoring with notifications
- Automated Deployment: One command to deploy the entire cluster
- Verification: Testing your cluster thoroughly
What's Next?
In Part 3, we'll cover daily administration tasks, troubleshooting, security best practices, and advanced resource management.
Resources
- GitHub Repository: RiverXData Slurm Ansible
- Deployment Docs: Scalable Slurm Deployment
- Architecture Overview: Slurm Architecture
- Ansible Documentation: docs.ansible.com
Contact
Questions about the deployment? Reach out at: nttg8100@gmail.com
This is Part 2 of the RiverXData series on building Slurm HPC clusters. Continue to Part 3 for administration and best practices.